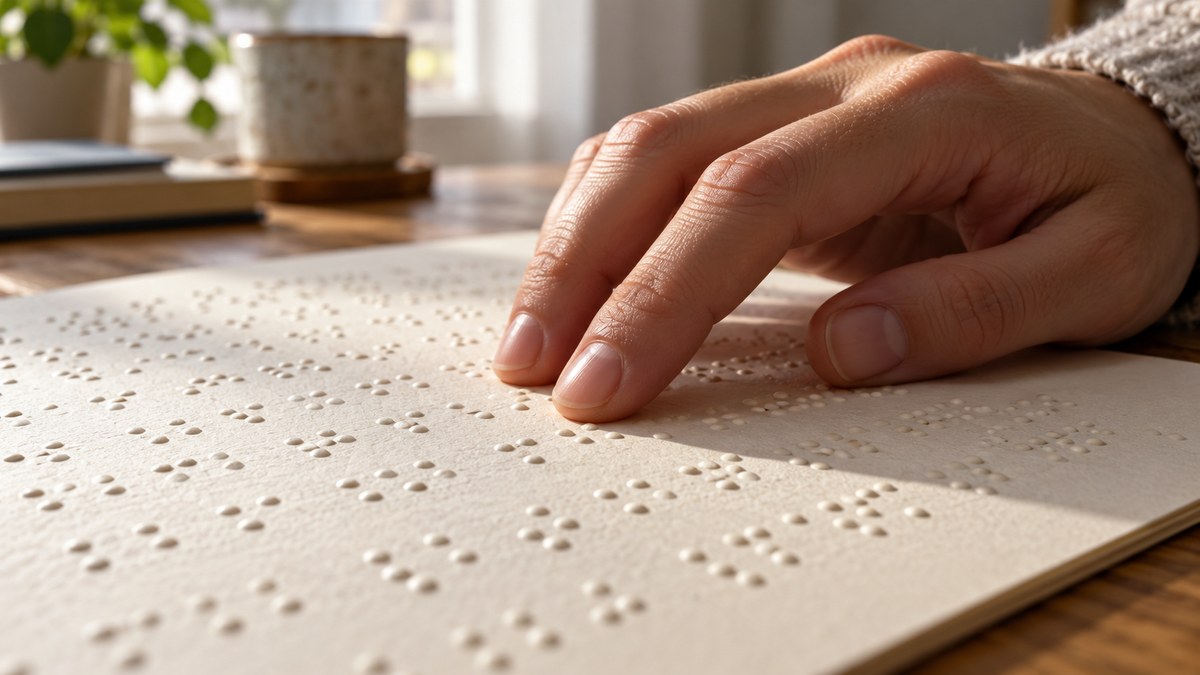
Paper, Screen or Audio: How Do People Read?
A US survey compares printed books, e-books and audiobooks.
Estimated CEFR reading level: A2. Short factual sentences, familiar everyday vocabulary and simple percentages. New survey words are explained below. This is an editorial estimate, not an official certification.

Five useful words
British English pronunciation (IPA). Audio uses an available English voice on your device.
survey /ˈsɜːveɪ/
nounA set of questions asked to learn about a group of people.
Our class did a survey about favourite foods.
format /ˈfɔːmæt/
nounThe form in which something is made or used.
This lesson is available in a video format.
printed /ˈprɪntɪd/
adjectiveMade with words or pictures on paper.
She keeps a printed copy of the map.
digital /ˈdɪdʒɪtəl/
adjectiveUsing information stored on a computer or electronic device.
I sent him a digital photo.
percent /pəˈsent/
nounA number out of one hundred.
Fifty percent means fifty out of one hundred.
The story
Pew Research Center asked 8,046 US adults about books from 6 to 16 October 2025. It published the results in April 2026.
About 75% said they had read all or part of a book in the past 12 months. They did not have to finish a whole book to answer yes.
Printed books were most common: 64% had read one. About 31% had read an e-book, and 26% had listened to an audiobook.
The format groups overlap because some people used more than one. Someone might read on paper at home and listen on the bus. As a result, the percentages add up to more than 100%. The survey describes US adults; it does not show how everyone in the world reads.
Book formats used by US adults
Share who said they used each format in the past 12 months. All bars use the same 0-100% scale.
View the numbers as a table
| Format | Share |
|---|---|
| Printed book | 64% |
| E-book | 31% |
| Audiobook | 26% |
About the survey
Who: US adults. Sample: 8,046 people. Fieldwork: 6-16 October 2025. Interviews: online and by telephone. The results were weighted to represent the US adult population. The margin of sampling error for the full sample was plus or minus 1.7 percentage points. Answers were self-reported; the survey did not track people's reading.
Three questions
Try answering before you open the answer. You can use your own words.
- Which book format was most common in the survey?
Show answer
Printed books, reported by 64% of US adults.
- Did the 75% figure mean everyone in that group finished a book?
Show answer
No. Reading all or part of a book counted.
- Why do the three format percentages add up to more than 100%?
Show answer
A person could use more than one format, so the groups overlap.
Let's talk about it
Here are some ideas for a chat. Choose any you like.
- Do you prefer a printed book, an e-book or an audiobook?
- Where do you like to read or listen to a book?
- Which English book would you like to try?
- Do you like to finish one book before starting another?
- Would you enjoy talking about a book with someone who listened to it instead of reading it?
Comparing two numbers
Printed books were more common than e-books in this survey. Use more ... than to compare two things. Try: "I read more ___ than ___."
Sources and context
An original learning article by Poly-Puff, written from the factual sources below. Sources checked on 4 October 2026. The artwork and learning activities were created for this article.